Converting Waste Into Profit With Energy Mapping
It happens every day in plants around the world: not getting the highest amount of usable power from every kWh. It’s a waste of time, money, opportunity, and energy.
What is Energy Waste?
In industrial manufacturing plants or commercial operations, waste is when 100% of energy isn’t generating work or producing revenue. Even with the energy efficiency of electrical and electro-mechanical equipment improved by some equipment manufacturers up to 95%, it’s possible to reduce waste further.
The Benefits of Waste Reduction
Why try to control waste even when efficiency percentages are high? Because reducing waste even by a small percentage improves profitability. The avoidance of poor power factor utility surcharges or increased peak demand usage charges can lead to substantial annual operating expense savings by improving electrical energy conversion into useful work.
Second, maintaining and running machinery at optimum performance levels reduces the risk of unintended shutdowns and extends equipment lifespan. Proper maintenance also reduces overall consumption.
Third, it makes sense to improve quality and environmental management, as ISO 50001 standards specify. ISO compliance demonstrates active engagement in sustainable practices—a plus for community and business relationships that enhance your brand.
Before improvements can begin, identify the root cause of waste—usually excessive reactive power.
Limiting Reactive Power Drives Efficiency
In AC electrical systems, true power produces effective work transferred to loads like transformers, heaters, and motors. Reactive power is the power that bounces back and forth between source and load and is unavailable for effective work in circuits or systems, resulting in diminished work generation capacity.
Most utilities track power factor (PF) as a measure of efficiency (Active/Reactive Power) and impose additional charges depending on how far below 100 % real power (or ‘1’) a system has fallen. The usual requirement for customers is to stay above .85 PF. Identifying and correcting inductive loads with excessive reactive power is a sure way to achieve sustainable savings by avoiding unnecessary PF charges.
Energy Mapping to Identify Waste and Corrective Action Pathways
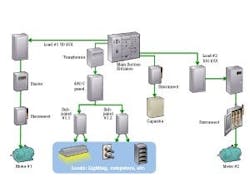
Mapping energy use of specific equipment and processes quantifies where waste occurs and shows the way to corrective actions to deliver the best return on investment. The following energy mapping use cases illustrate common causes of energy waste, how to identify and quantify them, and corrective action:
1: Electromechanical Systems
The interaction of electrical and mechanical systems converts electromechanical energy into mechanical movement—or sometimes the other way around. With so many moving parts, wear and tear causes energy waste.
Common Causes of Waste:
- Excess Friction: Alignment, bearings, imbalance, looseness is overworking the motor or surplus power consumption.
- Uncontrolled Loads: Left on after hours, run at peak rate times, more output than required, or over-voltage/current conditions and phase unbalance.
- Aging Mechanical Devices: Consume more power than new high-efficiency models.
How to Identify and Quantify Waste:
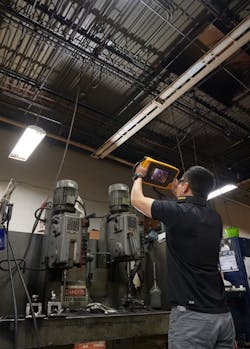
- Use Thermal Scans: Drive panel and mechanical load for overheating indicative of electrical inefficiency, couplings/shaft/belts, bearings, fan termination/junction box and windings, and insulation resistance testing.
- Log Power Over Time: Check total kWh, power factor, peak demand, unbalance, and harmonics.
- Test Vibration Levels: Review against standards and identify maintenance solutions.
- Confirm: Current and voltage levels.
A German steel recycling plant tested the vibration of a belt-driven process cooling fan. It was found to be moderately unbalanced and had misalignment and bearing wear. A 350-kW motor ran at 80% nominal power, with measured power found to be 280 kW. After rebalancing, the company had positive results withower consumption reduced by 3%.
2: Compressed Air Systems
Air kept under greater-than-atmospheric-pressure transfers energy to power many industrial processes. It’s a more expensive utility than electricity, natural gas, and water, which is why it’s essential to contain costs.
Common causes of waste:
- Leaking: Excessive leaks in compressed air lines lead to excess operation to maintain supply.
- Overrun: Compressors left on outside of normal work times.
How to identify and quantify waste:
- Log: Add a power log at the compressor to monitor baseline consumption.
- Measure: Pressure at compressor and point of use to determine the amount of compression drop.
- Ultrasound: Scan lines to identify leaks.
Compressed Air System Use Case
A U.S. manufacturer wanted to limit energy waste in their compressed air system. Using ultrasound inspection and complete compressor data logging, they found that the compressed air produced far exceeded demand. Weekend compressor shutdowns, installing solenoids, repairing 36 leaks, and new filter installation created significant savings of $50,600 annually.
3: Steam Systems
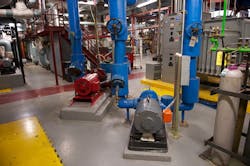
Steam-derived energy is used in almost every industry to deliver heat and motive power and require close attention to assure optimal performance.
Common Cause of Waste:
- Failed Steam Traps and Insufficient insulation: Wastes steam, causing over-production to maintain the necessary supply.
How to Identify and Quantify Waste:
- Power Log: At the boiler to monitor baseline consumption.
- Thermal Scans: Examine pipes and traps to identify insulation gaps and blockages.
Steam System Use Case
A U.S. manufacturer conducted a thermal inspection of boilers and steam lines. Six steam traps weren’t operating correctly, coils were leaking in plating tanks, and leaks at plating lines prevented opportunities to recover condensate. The failed traps were replaced at $500 each, and an energy log was added to the supply panel to detect leaks and condensate issues. Savings of $3,200 per trap using the known cost to generate steam and heat loss calculations resulted in total savings of $16,200.
Tracking and Energy-Saving Tips
Understanding essential energy components enable electricians to set up logging equipment to measure the level, location, timing, and quality of consumption. Here are some tips:
- Log at the Right Places and Times: At main and secondary panels and major loads, log and record kW, kWh, and power factors over a representative period for an accurate picture of the power consumption on three-phase circuits and loads.
- Determine Usage Peaks: Evaluate power factor and overall power consumption compared to utility invoices.
- Reschedule Loads: Take advantage of times of day when power is cheaper. Check how far below "1" the power factor is, and utility bills for poor power factor penalties. If so, the power logger can trace the sources. Once you've made energy upgrades, reconnect the logger to prove efficiency improvement benefits.
Boost Your Competitive Edge
Reducing energy consumption is good business, and provides you with excellent choices: do you funnel savings into increasing the plant yield or into other business strategies? By reducing overall energy consumption, companies can boost profits and brand perception.


