2014 Business Outlook
From small parts to massive structures, forging is so central to manufacturing and industrial production that it’s tempting to view this industry as an analog to the broader economy. It is not: forging has its own internal cost structures, production schedules, skill requirements, and regulatory obligations. Its strengths and vulnerabilities are more acute than the broader industrial and manufacturing sector — so when we are presented with analysis declaring a manufacturing recovery, what are we to conclude about the state of the forging industry as 2014 arrives?
Economists and forecasters (mostly) have settled on the story of a manufacturing comeback – five years after a total market collapse and 30 years or more after the emergence of the belief that domestic manufacturing would continue its steady decline against global competition.
Each month, the PMI averages responses from purchasing managers in 18 industrial segments to identify the trends in industrial expansion — better, same, or worse than the previous month. The results are tabulated so that the percentage of respondents reporting better (or same, or worse) conditions is measured against the previous month’s comparable result. It documents growth (or recession) because it follows the trend of activity in 18 manufacturing industries. And, broadly speaking, manufacturing is growing.
So, from above the trend indicates a solid and expanding industrial economy, and it’s broad enough to incorporate the many different manufacturing segments. The question for us, now, is whether the executives and operators trust the trend to drive their own business activities.
Each year we trust our readers to help forecast the business climate in the forging industry, clarifying the conditions in the current year and defining expectations for the year ahead.
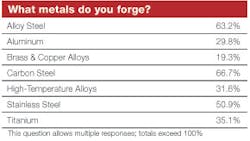
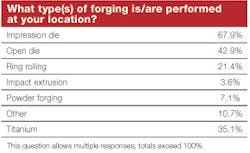
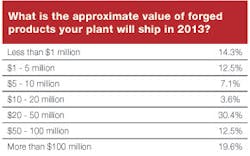
Our respondents represent the diversity of interests and experience within North American forging. All major metal types and forging processes are well represented, and their operations suggest a realistic balance of plant or operations sizes, from less than 20 workers to 250 or more.
Trust This Trend?
The survey starts in the present time: Overall, our respondents are nearly perfectly split on their evaluation of current conditions, segregating essentially into equal thirds as to whether this year’s total shipment volume will increase from 2012’s total (32.8%), decrease (34.5%), or remain the even (32.8%).
A closer examination of those responses finds locates the greater confidence between impression die and impact forging operations. The greatest degree of doubt about improvement is among ring rollers, while the most inconclusive respondents are open-die forgers. (Powder forging respondents are split between expecting a decline or expecting no change.)
As to the scale of their confidence: among those forgers who predict shipments for the current calendar year will improve on last year’s result, 70% see that increase at 1-10%; 10% expect an increase of 11-20%; 10% see an increase 41-50%; 5% see an increase of 51-60%; and 5% expect shipments will increase 91-100% over 2013.
On the other side, the respondents who expect declining shipment totals this year versus 2012 split this way: 36.4% foresee the decline at 1-10%; 27.3% see the drop at 11-20%; 18.2% see a decline of 21-30%; 13.6% expect a decline of 31-40%; and 4.5% believe their 2013 shipments will fall 51-60% behind the 2012 outcome.
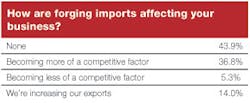
The constant consideration in matters of capacity utilization is cheap foreign imports. We inquired of our readers what effect imports have had on their business in 2013. There is/has been no effect from imports, say 43.9% of respondents, while 36.8% say imports are increasingly competitive; just 5.3% believe the effects of imports are decreasing, and 14.0% of respondents indicate their operations are increasingly competitive as exporters of forgings.
Gauging the Year Ahead
Next, we asked respondents to take a similar measure of the year to come. Confidence is high, with 46.6% predicting 2014 shipments will increase over 2013 totals; 6.9% predicting a decline in 2014 shipments; and 46.6% anticipating shipments to match this year’s results.
Among the respondents, impression die forgers, ring rollers, and impact forgers share the most positive outlook. The small number of forgers predicting decreasing shipments is a minority of impression-die and open-die forgers. Those who expect results even with the 2013 shipment totals are majorities of powder forgers and open-die forgers, and half of all ring-rolling responders.
The positive forecast for 2014 shipments breaks out this way: 54.8% of those expecting rising shipment totals believe that increase will be 1-10% greater than the 2013 total; 25.8% believe it will be an 11-20% increase; 6.5% expect a 21-30% increase; and 6.5% expect a 31-40% increase. A further 3.2% foresee an increase of 51-60% on 2013 shipments, and 3.2% believe the increase will be 91-100% greater than this year’s total.
Checking the other side of the scale – to be sure, a small number of respondents who believe 2014 shipment totals will trail the 2013 total: 20% believe the decrease will range 1-10%, year-on-year; 60% believe it will be an 11-20% decline; and 20% foresee a 21-30% drop.
To put a finer point on it, the new equipment purchases will be strongest among the open-die, impression-die, and ring-rolling operations. Plant expansions will be fairly evenly assigned across the operations, as will be the new plant projects.
To compare the investment trend, we note that 41.4% of respondents told us their capital spending totals will be “about the same” next year as it has been for the current year, and 34.5% indicated their spending total would increase. 24.1% reported next year’s capital spending will be less than it has been in 2013.
Much of the new investment will be financed without new debt, our respondents report. 52.0% will be maintaining their current debt levels, and 12.0% aim to reduce their debt levels in 2014.
Among the respondents who will be increasing capital spending in 2014, 28.6% will be raising their investment level by 1-10%, and 28.6% will be raising by 11-20%. 19.0% will be increasing investment by 21-30%; 4.8% will be increasing it by 51-60%; and 9.5% will be increasing spending by 71-80%.
Where does the money go?
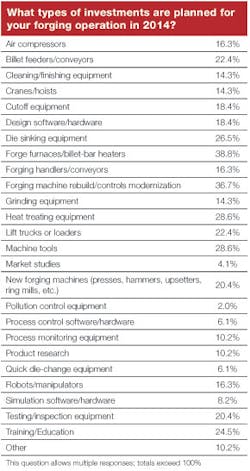
To understand how forgers plan to improve or expand their operations in 2014, we sought insight on their purchasing decisions. (Because we asked respondents to choose all applicable types of equipment they plan to invest in next year, the totals will exceed 100%.)
It’s a sign of sThe third-ranking area of new equipment choices is a tie between heat-treating equipment and machine tools. Again, the implication of this is that forgers plan to improve finished product quality and choices for the customers they supply – or aim to supply.
The next most popular investment choices will be die-sinking equipment (26.5%), training/education programs (24.5%), lift trucks/loaders and billet feeders/conveyors (tied, 22.4%), new forging presses/hammers/upsetters/ring mills and testing/inspection equipment (tied, 20.4%).
Issues That Matter
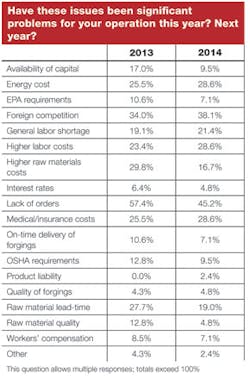
We sought to identify the issues that weigh on forgers’ planning and production efforts, and asked respondents to indicate the problems their businesses faced in 2013. (Again, we asked respondents to select all applicable choices, so the totals exceed 100%.)
The leading problem, by a wide margin, for forgers during 2013 has been a lack of orders, which affected 57.4% of all respondents. The next in rank has been foreign competition (34.0%), high raw material costs (29.8%), raw material lead times (27.4%), and energy costs (25.5%).
Projecting the same subject into 2014, the respondents identified a lack of orders (45.2%) as their most probable headache. That would be followed by foreign competition (38.1%), and in a three-way tie for future anxiety, energy costs, higher labor costs, and medical/insurance costs (all identified by 28.6% of respondents.)
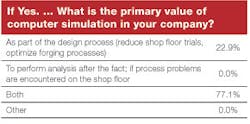
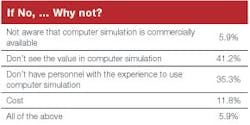
We recognize the expanding influence of simulation in design, planning for production, and production of forgings, and asked our respondents to frame this trend. 62.3% of all respondents have adopted simulation in some fashion. Among these respondents, 22.9% use the software for design and planning only; 77.1% use it for design and post-production analysis.
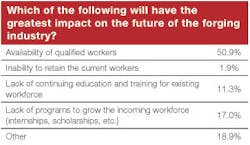
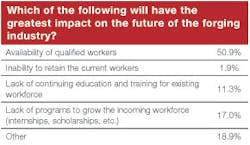
We sought respondents’ views on issues influence the forging industry at large, and 50.9% identified a need for qualified workers, with 17.0% citing a lack of programs to train new workers, and 11.3% identifying a lack of continuing education and training for the current workforce.
As 2013 ends, forging operators and executives are sober about their future. Their responses to the 2014 FORGING Business Outlook Survey prove they acknowledge the recent growth of the market, and recognize their opportunities. But they are cautious as 2014 begins, and that cautiousness is based on experience, too.
