Die Life Optimization by Numerical Modeling
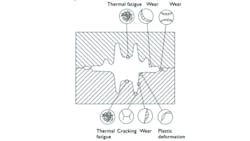
Die life is a major concern for the forging industry, and cracking followed by die wear is the most prevalent failure mechanism for forging dies (see Figure 1) Improving die life by avoiding premature die failure due to cracking is one of the dominating challenges that die and forging process engineers are facing.
During recent seminars conducted by Simufact Engineering GmbH, one-third of the participants identified die failure as a significant challenge for their company. This is not a representative result, but it motivated us to demonstrate how the numerical process simulation tool Simufact.forming can be used to increase die life significantly, optimizing the forging process by optimizing the pre-shape produced in the blocker stage. This is achieved by removing excess material.
This has three major positive effects that will reduce manufacturing costs significantly: increased die life, material savings, and greater productivity due to less frequent die change.
The optimization can be done for components in production, and for new products by introducing die-life studies during the forging die design phase.
When complete fill of the die cavity is reached too early, before the final stroke is reached, very high (hydrostatic) stresses develop in the forged workpiece because the material can flow only into the flash area. This results in high (tensile) stresses in the forging dies. These stresses are so great that after a limited number of forgings the dies will fail at the point where the high stresses are felt, resulting in a visible crack.
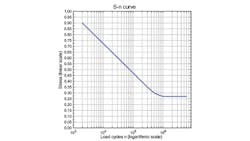
The life span of steels under high cyclic loading is described by S-N curves. Figure 2 is a graph of the magnitude of cyclic stress (S) against the logarithmic scale of cycles to failure (n.) It shows the expected number of loadings (number of parts that a blocker or finisher die can produce) depending on the stress (max. tensile stress) loads on the die for a particular die material.
These curves indicate approximately how many load cycles a certain material can withstand. Because these curves are determined in laboratory conditions (uni-axial stresses, uniform peak stresses, sinusoidal loading, constant temperature) the load cycle numbers given in the S-N diagram cannot predict the exact number of components a die can produce. Nonetheless, the principle behavior is correctly described and reveals the key to improving the die life.
At low-stress values, the material can withstand an infinite number of loads, which is called the fatigue limit and equals about one million load cycles (10°). Forging dies are subject to much higher loads and their life span is much shorter—a few hundred to approximately 40,000 load cycles (forgings) their behavior is determined by the low-cycle fatigue characteristics where slight changes of the stress can have a large impact on the life span. Hence, even a slight reduction of the stress (e.g., 20%) has a large impact on the die-life.
This means that if die life is to be increased, the primary goal should be to reduce the tensile peak stresses in the dies. For this task, the details of the S-N curve are not even required.
The stresses in the dies reach their maximum when complete die filling is reached. Thereafter, excess material can leave the cavity only through the flash, which requires very high pressure (hydrostatic stresses) within the workpiece. This causes high contact stresses on the tools and finally high tensile stresses in the edges of the tool cavity.
This mechanism applies not only to complete die filling of the entire cavity but also to locally premature die filling, which can significantly increase the die stresses in a local region. An adjusted material distribution by optimized preform is the key to reducing the excessive die stresses for significant die life improvement. Let’s study this in a real-life example.
Analysis of the Original Process
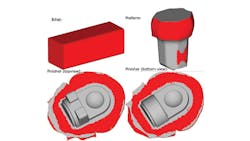
Figure 3 shows the workpiece geometries of the forging process analyzed with Simufact.forming. The finisher shows to the experienced reader that the flash area is rather large, but the experienced reader also will agree that this is a common sight in forging shops.
Now, Figure 4 shows the development of die filling during the finisher stage. These simulation results reveal that complete die-filling occurs 0.11 inches (2.9 millimeters) before the final stroke is reached in this forging process. This is too early and results in excessive flash, which is wasted material.
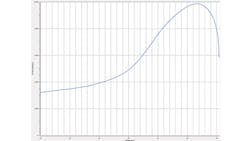
But, this is not the only negative effect. Figure 5 shows the force development as a function of stroke for the last 0.12 inches (3 millimeters) of stroke, in which the press force is rising from 5,000 to 10,000 tons. Due to the excess material that has to flow from the cavity into the flash, the force requirement is very high. This results in high stress in the dies, and therefore poor die life.
The total time to carry out this simulation, including all forming stages, the initial heating, and intermediate cooling times during the transport was less than 6 hours, using a single Intel i7 CPU on a modern laptop.
First Modification
Billet Length
The top view of the finisher (Figure 6) shows that the largest flash extension is in the lower half of the component. This flash pattern is used to calculate the excessive material, which volume can be approximately calculated as follows:
Area of flash = Area of outer box (11.8 x 15.7 inches [300 x 400 millimeters]) - Area of inner box (6.5 x 9.4 inches [165 x 240 millimeters])
Area of flash = 4.9 cubic inches (80,400 cubic millimeters)
Given a flash thickness of 0.12 inches (3 millimeters), the flash volume is 14.7 cubic inches (241,200 cubic millimeters)
Since we cannot remove the flash entirely, let’s remove 40% of the flash volume. This is 8.8 cubic inches (144,000 cubic millimeters) and equals 4% of the billet volume.
Our initial billet is 0.17 square inches (110 square millimeters), with rounded edges, with r = 0.2 inches (5 millimeters), and a length of 12 inches (305 millimeters). Its volume must be reduced by the amount as calculated. Then, its new length is 11.5 inches (293 millimeters). Because only the length of the billet is modified and not its cross-sectional geometry, this modification can be carried out easily.
Second Modification
Lower Die for Preform Operation
The second modification requires a die modification. As Figure 6 indicates, there is a more excessive flash in the lower part of the workpiece. To keep the costs of modification as low as possible, the fewest possible dies should be modified. To have a more balanced pre-distribution of the material it was decided to slightly modify the lower die of the preform operation, which is shown in Figure 7. The lower die geometry was scaled in x and z directions by a factor of 0.978, which reduced the volume of the cavity by approximately 4%.
Verification of the Optimized Process
These two modifications required only a few minutes of pre-processing work in Simufact.forming and then the modified process was simulated. Figure 8 shows the die filling of the finisher and compares it to the original process. It is clearly visible that the excessive flash was reduced and the part is still completely filled, and the flash surrounds its entire circumference. The die cavity is filled at 0.04 inches (0.9 millimeters) before the final stroke is reached.
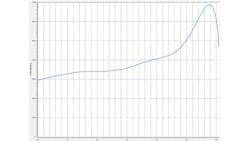
Simulated press forces for the optimized process layout of the finisher are shown in Figure 9. The peak force is now just below 7,000 tons, whereas the peak force of the original process was 10,000 tons, as shown in Figure 6. The 4% smaller billet volume effectively reduced the peak force by 30%.
A de-coupled die stress analysis was carried out to compare the maximum tensile stresses in the dies for the original and the modified processes. The maximum tensile stresses of the original and the optimized process are compared in Figure 10.
The press fit to optimize pre-stressing conditions was left unchanged, and this bears some additional optimization potential to reduce the tensile die stresses further, but the most effective way is to reduce too-early die filling and excessive flash.
Reducing excess flash, as described here, requires the initial billet geometry to be cut or crop-sheared with higher precision, to match the optimized input volume. Neglecting this requirement might result in more frequent under fills, or reduce the die life gains.
Conclusions, Outlook
This study demonstrates several benefits that are easy to achieve for forging processes that have been originally laid out manually, without the help of modern simulation tools to optimize the initial billet size and preform operations. In this study three main benefits have been achieved:
- 4% lower material requirement per forging
- 30% lower press force requirement in the finisher stage
- 25% lower die stresses, increasing die life approximately five to 10 times
There are also secondary benefits to simulating the processes:
- Efforts and costs to handle the trimmed flash will be reduced.
- Lower press force requirement also results in energy saving. Likewise, the reduced force makes it possible to use a smaller press with lower operating costs. Furthermore, larger forgings can be produced on the same press, which will increase the product range that can be produced on the available presses.
- Lower die wear due to reduced contact stresses and less material that must flow into the flash.
Since this optimization can be done in the design phase for a new forging component, as well as for products already in production, the rate of utilization for the simulation software will be high, typically achieving a return on investment within one year.
Besides the fundamental optimization of the billet volume and optimization of the preform geometry, numerical simulations can be used for further optimizations, like:
- Optimization of the position of the cavity within the die to reduce eccentric forces acting on the press
- Optimization of pre-stressing of the die by optimizing the shrinkage assembly to increase die life
Dr. Gabriel McBain ([email protected]) is the Director of Simufact India Pvt. Ltd. Dr. Hendrik Schafstall ([email protected]) is the Managing Director and CTO of simufact engineering GmbH. Arjaan Buijk ([email protected]) is the Managing Director of Simufact-Americas LLC
Reference
[1] "Uddeholm tool steel for forging applications," edition 1 08.2010; available for download at www.uddeholm.com
About the Author
Arjaan Buijk
Managing Director
Arjaan Buijk ([email protected]) is the Managing Director of Simufact-Americas LLC
Dr. Gabriel McBain
Director, Simufact India Pvt. Ltd.
Dr. Gabriel McBain is the Director of Simufact India Pvt. Ltd.
Dr. Hendrik Schafstall
Managing Director and CTO, Simufact engineering GmbH
Dr. Hendrik Schafstall is the Managing Director and CTO of Simufact engineering GmbH.
