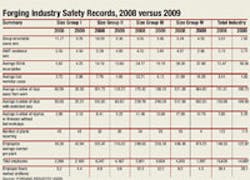
Safety is or ought to be a constant priority for forgers, and each year the Forging Industry Assn. surveys its producer members in order track the industry’s overall safety performance. The results also help FIA to identify its annual safety award winners. These awards are given in each of four groups, to which plants are assigned according to their average annual employment total. Group I represents companies with up to 80 employees, Group II includes companies with 81 to 175 employees, Group III covers companies with 176 to 325 employees, and Group IV is for companies with326 employees or more.
The data for the survey is gathered from questionnaires mailed annually to all FIA producer members. Producer members provide the data recorded on OSHA Form No. 300, “Summary of Occupational Injuries/ Illnesses for Calendar Year,” for U.S. companies, and from Worker’s Compensation Reports for Canadian companies. Completed returns provide the basis not only for FIA’s Annual Safety and Health Awards, but also for its Annual Occupational Injury & Illness Report.
The survey tracks a series of recordable figures, but the emphasis remains on the well-known metric for tracking industrial safety — the DART Incidence Rate (Days Away from work, work Restrictions, or job Transfer cases.) In virtually every category the forging industry demonstrated improvement in 2009 versus 2008.
FIA’s report provides a summary for the total industry and detailed company rankings, according to the Incidence Rate among company size categories. Each participating company is included within one of four groups, according to its average annual employment. The number of employees is based on the entire forging operation for the company, plant, or division being reported, including executive, administrative, clerical, sales, maintenance, and production.
They’re all good, and getting better
A total of 112 operations were tracked by FIA for the 2009 Safety Survey, equal to the record number of participants that took part in the 2008 survey. First-, second-, and third-place finishers were chosen in each group. Companies are identified as winners of the Safety Award plaques for having the lowest Recordable Cases Incidence Rate, provided that the DART Incidence Rate falls below the group average. In the event that Recordable Incidence Rates are equal between two companies, the FIA Safety Committee used the lower DART Incidence Rate to determine the award.
Also, in each group the committee named Improvement Award winners, to recognize the company that demonstrates the greatest improvement in its DART Incidence Rate. This award is determined by the percentage of improvement in the DART Incidence Rate compared with the average of the last three years.
A certificate of recognition is awarded to each company that does not receive a first-, second-, or third-place award, but whose Recordable Incidence Rate falls below the group average — provided that the DART Incidence Rate also falls below the group average.
